Pythonには様々なデータ可視化ライブラリがありますが、私は最近Bokehというライブラリを知って、その便利さにハマってます!今回はBokehの簡単なチュートリアル的な内容を書きたいと思います。
Bokehとは?
Bokehって何?の答えを知るには下記の公式ページを見るのが一番良いと思います。ただ、日本語版はないようです。
Bokehの特徴をいくつか挙げると、
- 対話的な可視化ができる(対話的って何?というのは後で書きます)
- 斬新奇抜なグラフが描ける
- ビッグデータをリアルタイムで処理できる
- グラフを作るためにHTML・CSS・JavaScriptを書く必要がない
といった感じです。
ちなみにBokehの主な開発者は、有名なPythonパッケージであるAnacondaを開発している人たちのようです。
実際の開発者によるBokehについてのプレゼン資料がslideshareにあり、非常に面白いです。
Hassle Free Data Science Apps with Bokeh Webinar
Bokehを触って見る
それでは実際にBokehを触ってみようと思います。
#Importing libraries
from bokeh.plotting import figure
from bokeh.io import output_file, show

#prepare data
x = [1,2,3,4,5]
y = [6,7,8,9,10]

#prepare the output file
output_file("Line.html")

#create figure
fig = figure()
fig.line(x, y)
show(fig)
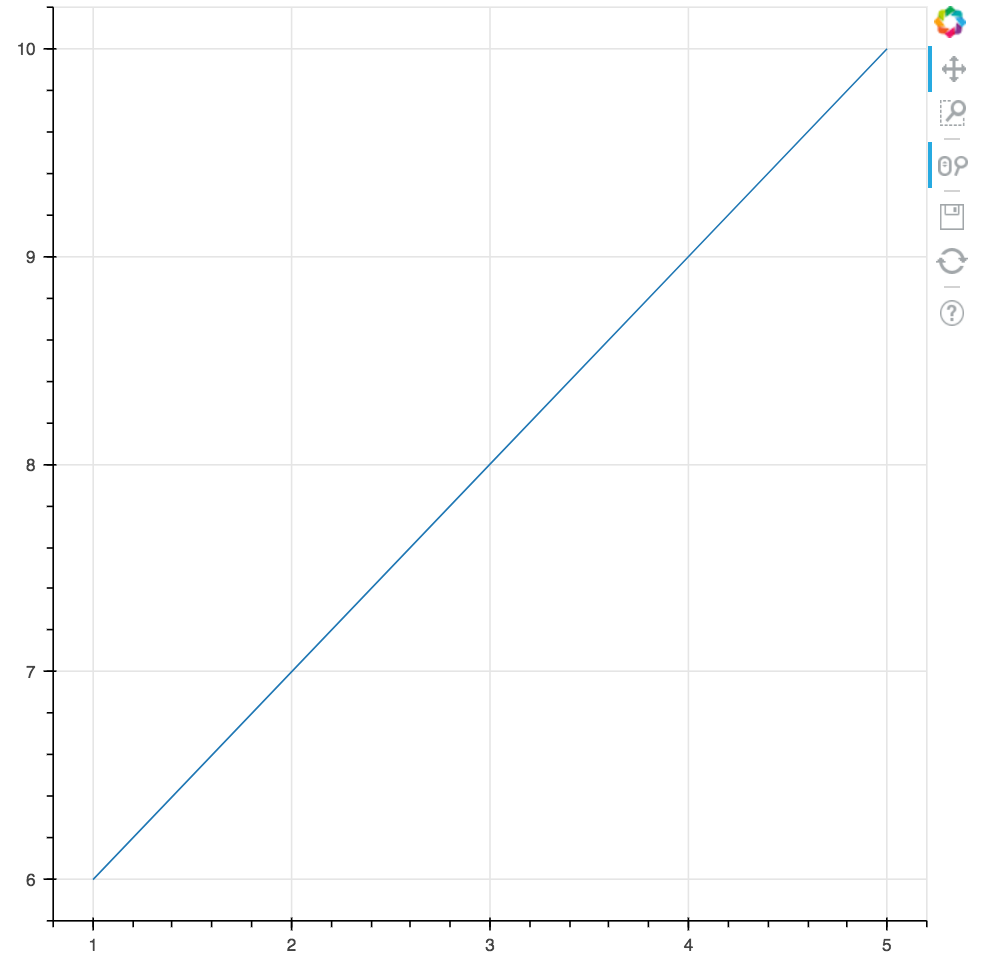
こんな短いコードで対話的なグラフが描けます。今回データについてはコードに直書きしています。こちらを実行すると(コマンドラインでpython file名を叩くと)、ブラウザ上にページが立ち上がり、下のようにグラフが描画されています。

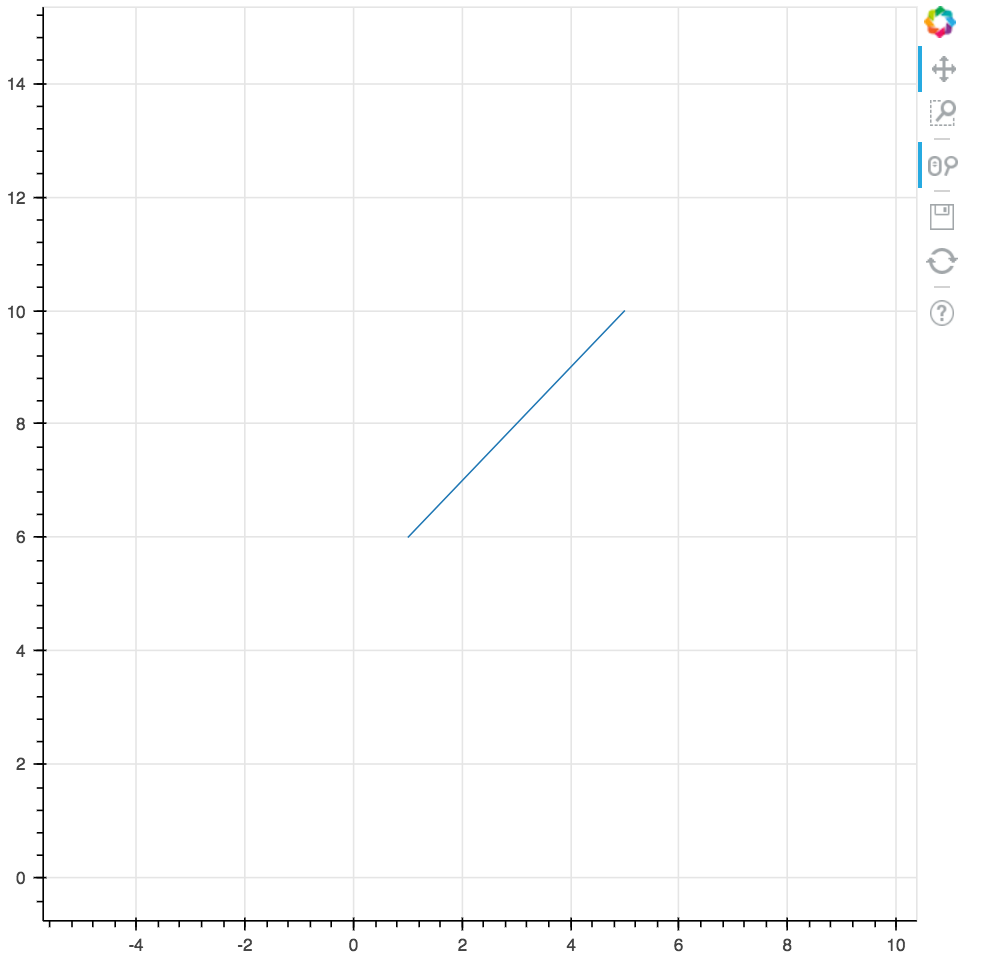
これを右上にドラッグすると、

スクロールすると、

対話的とはこういうことで、ユーザーの操作に対して即座に動きが返ってくる仕組みになっています。ぜひ実際にやってみてグラフをグリグリできる楽しさを味わってみてください!(動画を載せようと思ったのですが、パッと調べた感じYouTube等を使う方法しかなく、画像にしました。わかりづらくてすみません、いい方法あれば教えてください^^;)
上記のコードの中の
output_file("Line.html")
の部分で、Bokehが生成してくれたHTMLファイルも出力するようにしているので、出力されたHTMLの中をみてみましょう。
<!DOCTYPE html>
<html lang="en">
    <head>
        <meta charset="utf-8">
        <title>Bokeh Plot</title>

<link rel="stylesheet" href="https://cdn.pydata.org/bokeh/release/bokeh-0.12.2.min.css" type="text/css" />

<script type="text/javascript" src="https://cdn.pydata.org/bokeh/release/bokeh-0.12.2.min.js"></script>
<script type="text/javascript">
    Bokeh.set_log_level("info");
</script>
        <style>
          html {
            width: 100%;
            height: 100%;
          }
          body {
            width: 90%;
            height: 100%;
            margin: auto;
          }
        </style>
    </head>
    <body>

        <div class="bk-root">
            <div class="plotdiv" id="a7161ecc-bd75-43de-9089-247eb36da918"></div>
        </div>

        <script type="text/javascript">
            Bokeh.$(function() {
            Bokeh.safely(function() {
                var docs_json = {"ceb05a6f-303a-42ec-8fe1-717a3c3ba468":{"roots":{"references":[{"attributes":{"overlay":{"id":"c8df6c4b-20d9-4d00-ab91-8696851c6517","type":"BoxAnnotation"},"plot":{"id":"89f15627-1da2-4be9-8b49-7242d04f73e2","subtype":"Figure","type":"Plot"}},"id":"fe131afa-6cb9-4027-8e5e-81f50a7f7c2f","type":"BoxZoomTool"},{"attributes":{"formatter":{"id":"e9a2431f-b252-4bc6-86ca-98dd06d792ca","type":"BasicTickFormatter"},"plot":{"id":"89f15627-1da2-4be9-8b49-7242d04f73e2","subtype":"Figure","type":"Plot"},"ticker":{"id":"1e5e43c3-495b-471d-a871-7f085567f5fe","type":"BasicTicker"}},"id":"272fbeb6-e972-4283-94f3-c5c01022aaf3","type":"LinearAxis"},{"attributes":{"callback":null},"id":"50aa3059-7d61-402f-96d9-e51c4d7b4ab4","type":"DataRange1d"},{"attributes":{"bottom_units":"screen","fill_alpha":{"value":0.5},"fill_color":{"value":"lightgrey"},"left_units":"screen","level":"overlay","line_alpha":{"value":1.0},"line_color":{"value":"black"},"line_dash":[4,4],"line_width":{"value":2},"plot":null,"render_mode":"css","right_units":"screen","top_units":"screen"},"id":"c8df6c4b-20d9-4d00-ab91-8696851c6517","type":"BoxAnnotation"},{"attributes":{"plot":{"id":"89f15627-1da2-4be9-8b49-7242d04f73e2","subtype":"Figure","type":"Plot"},"ticker":{"id":"6ccb7a55-c184-446a-b680-3135cd27775d","type":"BasicTicker"}},"id":"1844c54b-118b-452b-83bd-ed647412592f","type":"Grid"},{"attributes":{"data_source":{"id":"a13993f5-d7b0-4174-88bb-b90f2e6c1412","type":"ColumnDataSource"},"glyph":{"id":"bafa0919-8be4-4742-8c66-2805ce1f9da4","type":"Line"},"hover_glyph":null,"nonselection_glyph":{"id":"29ac1919-026e-4ed7-a866-b13a07c96bfe","type":"Line"},"selection_glyph":null},"id":"a7d00cc9-6e84-413a-a3e9-e1eb94796522","type":"GlyphRenderer"},{"attributes":{"formatter":{"id":"f521c266-6f21-4f57-8c1d-5d8196ce5fa2","type":"BasicTickFormatter"},"plot":{"id":"89f15627-1da2-4be9-8b49-7242d04f73e2","subtype":"Figure","type":"Plot"},"ticker":{"id":"6ccb7a55-c184-446a-b680-3135cd27775d","type":"BasicTicker"}},"id":"449bd4d4-7483-4290-88a0-f1593170ee1d","type":"LinearAxis"},{"attributes":{"plot":{"id":"89f15627-1da2-4be9-8b49-7242d04f73e2","subtype":"Figure","type":"Plot"}},"id":"d64e9c84-783f-4d2c-9254-46a5b09d79e8","type":"PanTool"},{"attributes":{"callback":null},"id":"963839b2-34d1-414c-be56-c84bdb1ef5cc","type":"DataRange1d"},{"attributes":{"plot":{"id":"89f15627-1da2-4be9-8b49-7242d04f73e2","subtype":"Figure","type":"Plot"}},"id":"9a747cea-226e-4006-b86a-6d6b186765f1","type":"WheelZoomTool"},{"attributes":{"plot":{"id":"89f15627-1da2-4be9-8b49-7242d04f73e2","subtype":"Figure","type":"Plot"}},"id":"8109f175-be7e-4f0f-b4b3-3d0bc4762177","type":"HelpTool"},{"attributes":{"line_alpha":{"value":0.1},"line_color":{"value":"#1f77b4"},"x":{"field":"x"},"y":{"field":"y"}},"id":"29ac1919-026e-4ed7-a866-b13a07c96bfe","type":"Line"},{"attributes":{},"id":"e9a2431f-b252-4bc6-86ca-98dd06d792ca","type":"BasicTickFormatter"},{"attributes":{"dimension":1,"plot":{"id":"89f15627-1da2-4be9-8b49-7242d04f73e2","subtype":"Figure","type":"Plot"},"ticker":{"id":"1e5e43c3-495b-471d-a871-7f085567f5fe","type":"BasicTicker"}},"id":"386d29c4-a962-48fe-815f-18666d39826c","type":"Grid"},{"attributes":{},"id":"f9cb966f-a936-4979-9465-afee14f8f21d","type":"ToolEvents"},{"attributes":{},"id":"6ccb7a55-c184-446a-b680-3135cd27775d","type":"BasicTicker"},{"attributes":{"plot":{"id":"89f15627-1da2-4be9-8b49-7242d04f73e2","subtype":"Figure","type":"Plot"}},"id":"2de10c54-d536-4ec1-9904-d39d9c57d1cb","type":"SaveTool"},{"attributes":{"callback":null,"column_names":["x","y"],"data":{"x":[1,2,3,4,5],"y":[6,7,8,9,10]}},"id":"a13993f5-d7b0-4174-88bb-b90f2e6c1412","type":"ColumnDataSource"},{"attributes":{"active_drag":"auto","active_scroll":"auto","active_tap":"auto","tools":[{"id":"d64e9c84-783f-4d2c-9254-46a5b09d79e8","type":"PanTool"},{"id":"9a747cea-226e-4006-b86a-6d6b186765f1","type":"WheelZoomTool"},{"id":"fe131afa-6cb9-4027-8e5e-81f50a7f7c2f","type":"BoxZoomTool"},{"id":"2de10c54-d536-4ec1-9904-d39d9c57d1cb","type":"SaveTool"},{"id":"5dc6dca4-c75b-428e-a030-60e291cd1162","type":"ResetTool"},{"id":"8109f175-be7e-4f0f-b4b3-3d0bc4762177","type":"HelpTool"}]},"id":"c1e5b658-fb25-422c-947d-a9e05d1babb9","type":"Toolbar"},{"attributes":{"line_color":{"value":"#1f77b4"},"x":{"field":"x"},"y":{"field":"y"}},"id":"bafa0919-8be4-4742-8c66-2805ce1f9da4","type":"Line"},{"attributes":{},"id":"1e5e43c3-495b-471d-a871-7f085567f5fe","type":"BasicTicker"},{"attributes":{},"id":"f521c266-6f21-4f57-8c1d-5d8196ce5fa2","type":"BasicTickFormatter"},{"attributes":{"below":[{"id":"449bd4d4-7483-4290-88a0-f1593170ee1d","type":"LinearAxis"}],"left":[{"id":"272fbeb6-e972-4283-94f3-c5c01022aaf3","type":"LinearAxis"}],"renderers":[{"id":"449bd4d4-7483-4290-88a0-f1593170ee1d","type":"LinearAxis"},{"id":"1844c54b-118b-452b-83bd-ed647412592f","type":"Grid"},{"id":"272fbeb6-e972-4283-94f3-c5c01022aaf3","type":"LinearAxis"},{"id":"386d29c4-a962-48fe-815f-18666d39826c","type":"Grid"},{"id":"c8df6c4b-20d9-4d00-ab91-8696851c6517","type":"BoxAnnotation"},{"id":"a7d00cc9-6e84-413a-a3e9-e1eb94796522","type":"GlyphRenderer"}],"title":{"id":"57403a00-d3e6-47c5-a4e0-0fb338855f24","type":"Title"},"tool_events":{"id":"f9cb966f-a936-4979-9465-afee14f8f21d","type":"ToolEvents"},"toolbar":{"id":"c1e5b658-fb25-422c-947d-a9e05d1babb9","type":"Toolbar"},"x_range":{"id":"50aa3059-7d61-402f-96d9-e51c4d7b4ab4","type":"DataRange1d"},"y_range":{"id":"963839b2-34d1-414c-be56-c84bdb1ef5cc","type":"DataRange1d"}},"id":"89f15627-1da2-4be9-8b49-7242d04f73e2","subtype":"Figure","type":"Plot"},{"attributes":{"plot":{"id":"89f15627-1da2-4be9-8b49-7242d04f73e2","subtype":"Figure","type":"Plot"}},"id":"5dc6dca4-c75b-428e-a030-60e291cd1162","type":"ResetTool"},{"attributes":{"plot":null,"text":null},"id":"57403a00-d3e6-47c5-a4e0-0fb338855f24","type":"Title"}],"root_ids":["89f15627-1da2-4be9-8b49-7242d04f73e2"]},"title":"Bokeh Application","version":"0.12.2"}};
                var render_items = [{"docid":"ceb05a6f-303a-42ec-8fe1-717a3c3ba468","elementid":"a7161ecc-bd75-43de-9089-247eb36da918","modelid":"89f15627-1da2-4be9-8b49-7242d04f73e2"}];

                Bokeh.embed.embed_items(docs_json, render_items);
            });
        });
        </script>
    </body>
</html>
データはJSON形式に変換されて、JavaScriptに渡されています。このようにHTML・CSS・JavaScriptとして出力されるため、Webとの親和性も高く、FlaskやDjangoを使ったアプリへの組み込みも容易にできます。
さいごに
Bokehの公式ページにあるギャラリーには超ファンシーなグラフたちがあり、実際に触れるようになっています。えっほんとにこんなことまでできるの?っていうものもあるので、ぜひ見てみてください!